Here are some of the system's best trades so far
US Portfolio

| Name (Ticker) | % P/L | Entry / Exit |
|---|---|---|
| KEMET Corporation (KEM) | 370.60% | Nov'16 / Sep'17 |
| Entravision Communications Corp (EVC) | 250.00% | Oct'20 / Nov'21 |
| LightInTheBox (LITB) | 130.91% | Jul'20 / Aug'20 |
| North European Oil Royalty Trust (NRT) | 86.40% | Mar'21 / Nov'21 |
| RADA Electronic Industries (RADA) | 79.13% | Jun'17 / Nov'17 |
| Avalon Holdings Corp (AWX) | 66.50% | Nov'20 / Mar'21 |
| Bovie Medical Corp (BVX) | 61.49% | Apr'18 / Oct'18 |
| Nevsun Resources Ltd (NSU) | 61.17% | Apr'18 / Sep'18 |
| Deswell Industries, Inc (DSWL) | 56.57% | Jun'17 / Nov'17 |
| DRDGOLD Ltd (DRD) | 46.56% | Jun'19 / Sep'19 |
Singapore Portfolio

| Name (Ticker) | % P/L | Entry / Exit |
|---|---|---|
| AEM Holdings (AWX.SI) | 247.16% | Dec'16 / May'17 |
| PropNex (OYY.SI) | 185.67% | Oct'20 / Sep'21 |
| Del Monte (D03.SI) | 140.04% | Dec'20 / Aug'21 |
| Medtecs Intl (546.SI) | 130.91% | Jun'20 / Jul'20 |
| Union Gas (1F2.SI) | 102.40% | Oct'20 / Aug'21 |
| 800 Super (5TG.SI) | 51.53% | Oct'16 / Jul'17 |
| HMI (588.SI) | 48.81% | Aug'16 / Feb'17 |
| Moya Holdings Asia Ltd (5WE.SI) | 45.90% | Aug'22 / Sep'22 |
| Chip Eng Seng Corp (C29.SI) | 38.10% | Jun'22 / Nov'22 |
| Perennial Hldgs (40S.SI) | 36.19% | May'20 / Jul'20 |
Historical Live Performance
Since the inception of the system in mid -2016, its performance has been well within the model. Here is the yearly returns of the system since inception. Calculation of the performance is based on absolute return.* To see the latest performance of the system which includes the total rand yearly returns, please visit the main page. The results are updated every month.
Backtesting Outcome
Backtesting is a crucial stage in the development of a trading system. It is where a trading model is fed with historical data to simulate trading over a timeframe. It is to determine whether the system has an edge and is profitable (positive alpha). Apart from that, it can also be used to determine the volatility of the system (beta) and other metrics. It is the same as test driving a car before purchasing in order to determine if it is up to your expectation.
If a trading model works well during backtesting, chances are it should also work well in the future. Of course, there are factors that may skew the future performance due to overfitting, testing bias, crappy historical data, short timeframe, among others but all these can be addressed and there are ways to minimise it
DIYQuant trading model was first tested using US stock market historical data. A similar trading model was then tested in Singapore market. Both produced phenomenal returns.
Get Full Access and follow our system's quest for ABNORMAL returns
Performance Join as Member
Follow our blog on Facebook!
Backtesting is a crucial stage in the development of a trading system. It is where a trading model is fed with historical data to simulate trading over a timeframe. It is to determine whether the system has an edge and is profitable (positive alpha). Apart from that, it can also be used to determine the volatility of the system (beta) and other metrics. It is the same as test driving a car before purchasing in order to determine if it is up to your expectation.
If a trading model works well during backtesting, chances are it should also work well in the future. Of course, there are factors that may skew the future performance due to overfitting, testing bias, crappy historical data, short timeframe, among others but all these can be addressed and there are ways to minimise it
DIYQuant trading model was first tested using US stock market historical data. A similar trading model was then tested in Singapore market. Both produced phenomenal returns.
US Portfolio Simulation.
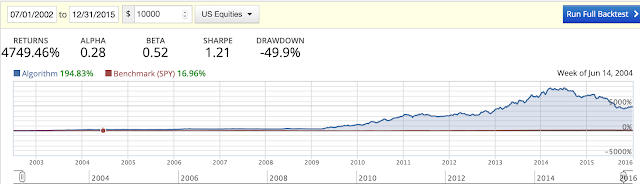
We used the historical data provided by Quantopian for backtesting DIYQuant trading model. The reason to use Quantopian is because the data is more reliable and trusted by many as it is meant for developing quant trading systems to be sent for competition. (so that no one will accuse us of scamming!). Below is the performance of the system running from 2002 to 2015. It is interesting to note that the beta is only 0.52 which means it is only half as volatile as the benchmark SPY but still beat it with an alpha of 0.28!
Check out this video that captures the simulation running in Quantopian from 2002 to 2015.
Yearly Returns 2002 - 2015 (Backtest)
+4749.47%
| -30.95% (2015) | -4.19% (2014) |
+71.94% (2013) | +41.97% (2012) | -5.00% (2011) |
| +142.00% (2010) | +195.00% (2009) | +3.00% (2008) | +1.00% (2007) | +21.00% (2006) |
| +9.08% (2005) | +20.92% (2004) | +158.47% (2003) | +2.40% (2002) |
Singapore Portfolio Simulation.
For Singapore portfolio the trading model is run using historical data curated from Yahoo Finance, Google Finance and other sites. Below is the performance of the system running from 2002 to 2015.Yearly Returns 2002 - 2015 (Backtest)
+5073.70%
| +70.81% (2015) | +21.79% (2014) | +67.60% (2013) | +1.26% (2012) |
+15.24% (2011) |
| +17.01% (2010) | +68.72% (2009) | -25.76% (2008) | +92.49% (2007) | +59.24% (2006) |
| +12.97% (2005) | +32.77% (2004) | +53.85% (2003) | +20.24% (2002) |
Get Full Access and follow our system's quest for ABNORMAL returns
Performance Join as Member
Follow our blog on Facebook!


![[Watchlist] US Stocks caught Trending on System's Radar for Week of 17th Sep 2018](https://blogger.googleusercontent.com/img/b/R29vZ2xl/AVvXsEjVlw8ePzHYbUGgNe8-I-gEMvS7StYEclF_E7lAhUHjHAXuTh1bUMXAt6Zg1o0qEFZfwIkS7__E3zVLFnLecU05bRmfsVTIxBqnwAsXocCDYCMCKYT3rXnPacIuEnANSsBQV6kHgPYQa8he/s72-c/stock-market-2616931_640.jpg)


![[Watchlist] US Stocks caught Trending on System's Radar for Week of 27th Aug 2018](https://blogger.googleusercontent.com/img/b/R29vZ2xl/AVvXsEhld7TDTlKp433twtL0Ha0L_Aky2PiMKIJCcjTHgd4gZ0AUcAx1Y0R0c4NkdGA8Zru5eDEU4Mnfa2786NG_5UEfTqI2Hh4GQG6gai8q4XeNDMSlKb51xm-O7VwmhIevASVx62B5IC2drPM4/s72-c/stocklist1.jpeg)
May I know the number of Buy/Sell calls in the last 4 months? And what are the results for each of these calls?
ReplyDelete