“Without data you’re just a person with an opinion.”
Dr W. Edwards Deming
I always have this hunch that whatever that is happening in the US indices will have a similar impact on Singapore's Straits Times Index (STI). If you have traded long enough, you will probably share the same observation. Take the recent US market downturn for example. S&P500 started to descend from its top on 28th Jan till 8th Feb 2018. At the same time STI logged a similar drop from a high on 24th Jan to the low on 9th Feb. S&P500 recorded a 10% plunge while STI had about 6% drop.
As a quant, I focus on cold hard data to determine whether a pattern truly exist. It was also how my system predicted the recent market fall - by analyzing data objectively.
This led me to perform a simple analysis to determine how correlated are these two indices (I picked S&P500 but using Dow Jones should yield similar results). I analysed using 12 years of historical percentage price changes of both indices (start date is 3rd Jan 2005).
Before I continue further, let's understand two terminologies that are used to perform the analysis.
Correlation - Correlation is a statistical technique that can show whether and how strongly pairs of variables are related.
Correlation Coefficient - The main result of a correlation is called the correlation coefficient (or "r"). It ranges from -1.0 to +1.0. The closer r is to +1 or -1, the more closely the two variables are related. If r is close to 0, it means there is no relationship between the variables. If r is positive, it means that as one variable gets larger the other gets larger. If r is negative it means that as one gets larger, the other gets smaller (often called an "inverse" correlation).
The correlation coefficient can be calculated in Excel via the function CORREL.
PS: Correlation coefficient can be used to determine relationship for any two sets of data not just historical prices. It can be used to determine even common scenario like whether an ice cream stall's sales is related to the temperature of the day.
When I plotted all the 12 years of daily price changes onto a scatter plot, I got the chart below. The correlation coefficient is 0.58 which is considered moderately strong correlation.
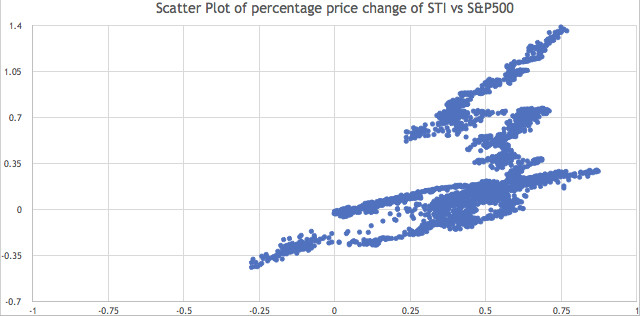
Looking at the chart, you can see almost 2 linear clusters (1) and (3). Cluster (2) is more haphazard and suggests a weakly correlated region.

This led me to suspect there could be a period of time when the 2 indices were not that in tandem. I split the prices into 3 periods. From 2005 - 2012, 2013 - 2016 and 2017 - 2018. Here are their individual scatter plots and their corresponding correlation coefficient r.
2005 - 2012
r = 0.75

From 2005 to 2012, the correlation is strong. This period includes the 2008 financial crisis that toppled most major markets in the world.
2013 - 2016
r = -0.21

2017 - 2018
r = 0.94

If we eyeball a superimposed chart of the STI and S&P500, you can see where the 3 regions lie.

Indeed we can see that from 2013 - 2016, STI was trading sideway while S&P500 was rising, hence the weak correlation. The reason for the lack of correlation during this period is due to local and regional factors that impacted Singapore economy such as the bear market in China and productivity decline in Singapore due to labour crunch. Other than that, the 2 charts are quite in sync.
If I were to indicate the few somewhat major corrections over the past 12 years, you can see that both US and Singapore were impacted. I also include the recovery points in the chart below. Having this knowledge allows us to identify regions of weakness and buying opportunities in the Singapore market based on the situation in US.

Using 12 years of historical data, I have shown you that for a large part of the time period, S&P500 and STI are strongly correlated. This is especially so in the recent years. Hence be prepared that whatever happen to US will impact Singapore market in a similar fashion in the future.
Given now that my system already sent out a warning on the signification risk of correction in the US, investors in Singapore should also protect their portfolio and properly manage their risk if they have yet to do so.
Performance
Join as Member
When I plotted all the 12 years of daily price changes onto a scatter plot, I got the chart below. The correlation coefficient is 0.58 which is considered moderately strong correlation.


This led me to suspect there could be a period of time when the 2 indices were not that in tandem. I split the prices into 3 periods. From 2005 - 2012, 2013 - 2016 and 2017 - 2018. Here are their individual scatter plots and their corresponding correlation coefficient r.
2005 - 2012
r = 0.75

From 2005 to 2012, the correlation is strong. This period includes the 2008 financial crisis that toppled most major markets in the world.
2013 - 2016
r = -0.21

From 2013 to 2016, r is only -0.2 which means they are weakly correlated.
2017 - 2018
r = 0.94

From 2017 to 2018, r is 0.94 which means that both indices are very strongly correlated. It is as if STI is riding on the same bike with S&P (STI riding the pillion though).
If we eyeball a superimposed chart of the STI and S&P500, you can see where the 3 regions lie.

Indeed we can see that from 2013 - 2016, STI was trading sideway while S&P500 was rising, hence the weak correlation. The reason for the lack of correlation during this period is due to local and regional factors that impacted Singapore economy such as the bear market in China and productivity decline in Singapore due to labour crunch. Other than that, the 2 charts are quite in sync.
If I were to indicate the few somewhat major corrections over the past 12 years, you can see that both US and Singapore were impacted. I also include the recovery points in the chart below. Having this knowledge allows us to identify regions of weakness and buying opportunities in the Singapore market based on the situation in US.

Using 12 years of historical data, I have shown you that for a large part of the time period, S&P500 and STI are strongly correlated. This is especially so in the recent years. Hence be prepared that whatever happen to US will impact Singapore market in a similar fashion in the future.
Given now that my system already sent out a warning on the signification risk of correction in the US, investors in Singapore should also protect their portfolio and properly manage their risk if they have yet to do so.
us on Facebook!


![[Watchlist] US Stocks caught Trending on System's Radar for Week of 17th Sep 2018](https://blogger.googleusercontent.com/img/b/R29vZ2xl/AVvXsEjVlw8ePzHYbUGgNe8-I-gEMvS7StYEclF_E7lAhUHjHAXuTh1bUMXAt6Zg1o0qEFZfwIkS7__E3zVLFnLecU05bRmfsVTIxBqnwAsXocCDYCMCKYT3rXnPacIuEnANSsBQV6kHgPYQa8he/s72-c/stock-market-2616931_640.jpg)


![[Watchlist] US Stocks caught Trending on System's Radar for Week of 27th Aug 2018](https://blogger.googleusercontent.com/img/b/R29vZ2xl/AVvXsEhld7TDTlKp433twtL0Ha0L_Aky2PiMKIJCcjTHgd4gZ0AUcAx1Y0R0c4NkdGA8Zru5eDEU4Mnfa2786NG_5UEfTqI2Hh4GQG6gai8q4XeNDMSlKb51xm-O7VwmhIevASVx62B5IC2drPM4/s72-c/stocklist1.jpeg)
No comments:
Post a Comment